In the midst of the Covid 19 lockdowns, I saw an animated graphic chart that tracked the Corona virus infection rates on a daily basis per country from mid January to the current day, and there was another that looked at how the Covid disease rated against other diseases over the same period of time, again on a daily basis. They are really very simple and clear indicators of how quickly this disease has spread around the world.
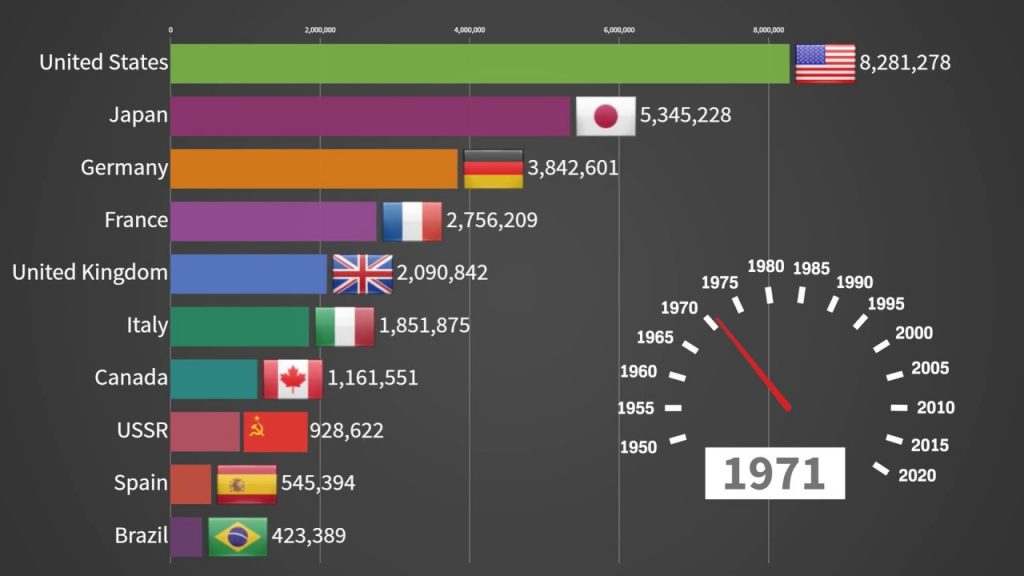
So I was interested recently when I came across a similar animated chart that shows the rankings of the world’s largest motor vehicle manufacturing countries production figures from 1950 to 2019 and how they have changed over the last 70 years.
These figures take into account passenger cars, light commercial vehicles, mini buses, trucks, buses and coaches, and although you may look at it and say there are no surprises there, what I found fascinating was the fluctuation of other countries over the period and the cumulative numbers of motor vehicles that have been produced.